Counter defines decadal period which the given statistic represents.
Use buttons [>>] and [<<]
to browse forward and backward in decadal periods. Use [Statistic]-menu to choose between
statistics. Use button [2x1]to switch to dual window mode to compare pairs of charts. You may also choose to browse actual temporal array.
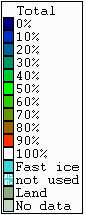
Given statistics are based on 10-days period information from AARI sea ice conditions charts prepared in World
Meteorologocal Organization SIGRID format (WMO, 1989) for 1950-1992 interval. Layer of sea ice total concentration
is depicted in polar stereographical projection.
See also:
[AARI charts] |
[NIC charts] |
[AARI versus NIC charts] |
[Statistics based on AARI data] |