Counter defines time period of observations upon which chart is based
(i.e. 1972, Jan 03). Use buttons [>>] and [<<]
to browse forward and backward in time. Use [Step]-menu to choose between
weekly, monthly and yearly step during browsing. Use button [1x1]
to switch to single window mode. Given array is based on processing weekly USA National
Ice Center (NIC) sea ice conditions charts prepared in World
Meteorological Organization SIGRID format (WMO, 1989) for 1972-1994 interval
separately for Arctic East (90W eastward to 90E; 45N to 90N) and
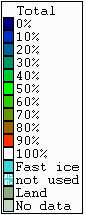
Arctic West (90E eastward to 90W; 45N to 90N). Layer of sea ice total concentration
is depicted in polar stereographical projection.
See also:
[AARI charts] |
[NIC charts] |
[AARI versus NIC charts] |
[Statistics based on AARI data] |