Counter defines time period of observations upon which chart is based
(i.e. 1901, Jan). Use buttons [>>] and [<<]
to browse forward and backward in time. Use [Step]-menu to choose between
monthly, yearly or decadal step during browsing. Use button [2x1]
to switch to dual window mode to compare pairs of charts. Use [Scroll] checkbox to (dis)enable autoscrolling. Use
[time] checkbox to switch scrolling forward and backward in time. Use buttond [+] and [-]
to accelarate or slow down autoscrolling.
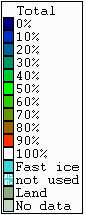
Given array is based on processing "Arctic and Southern Ocean Sea Ice Data"(also known as the Walsh data set, J.Walsh) monthly sea ice total concentration patterns for 1901-1997 interval.
See also:
[AARI charts] |
[NIC charts] |
[AARI versus NIC charts] |
[Statistics based on AARI data] |